Part 1 NixOSをinstall
Part 2 deply-rsでNixOS Configurationを適用
Part 3 ragenixでsecret管理
Part 4 opentelemetry-collectorとopenobserveでmetricsを取得
Part 5 CPUの温度をmetricsとして取得(👈 この記事)
Part 4でopentelemetry-collectorを導入してmetricsを取得してbackend(openobserve)に送れるようになりました。
Part 5ではopentelemetry-collectorの機能だけでは取得できないCPUの温度を取得して、metricsとして扱えるようにしていきます。
ゴールは以下のようにCPU温度をdashboardに表示するところまでです。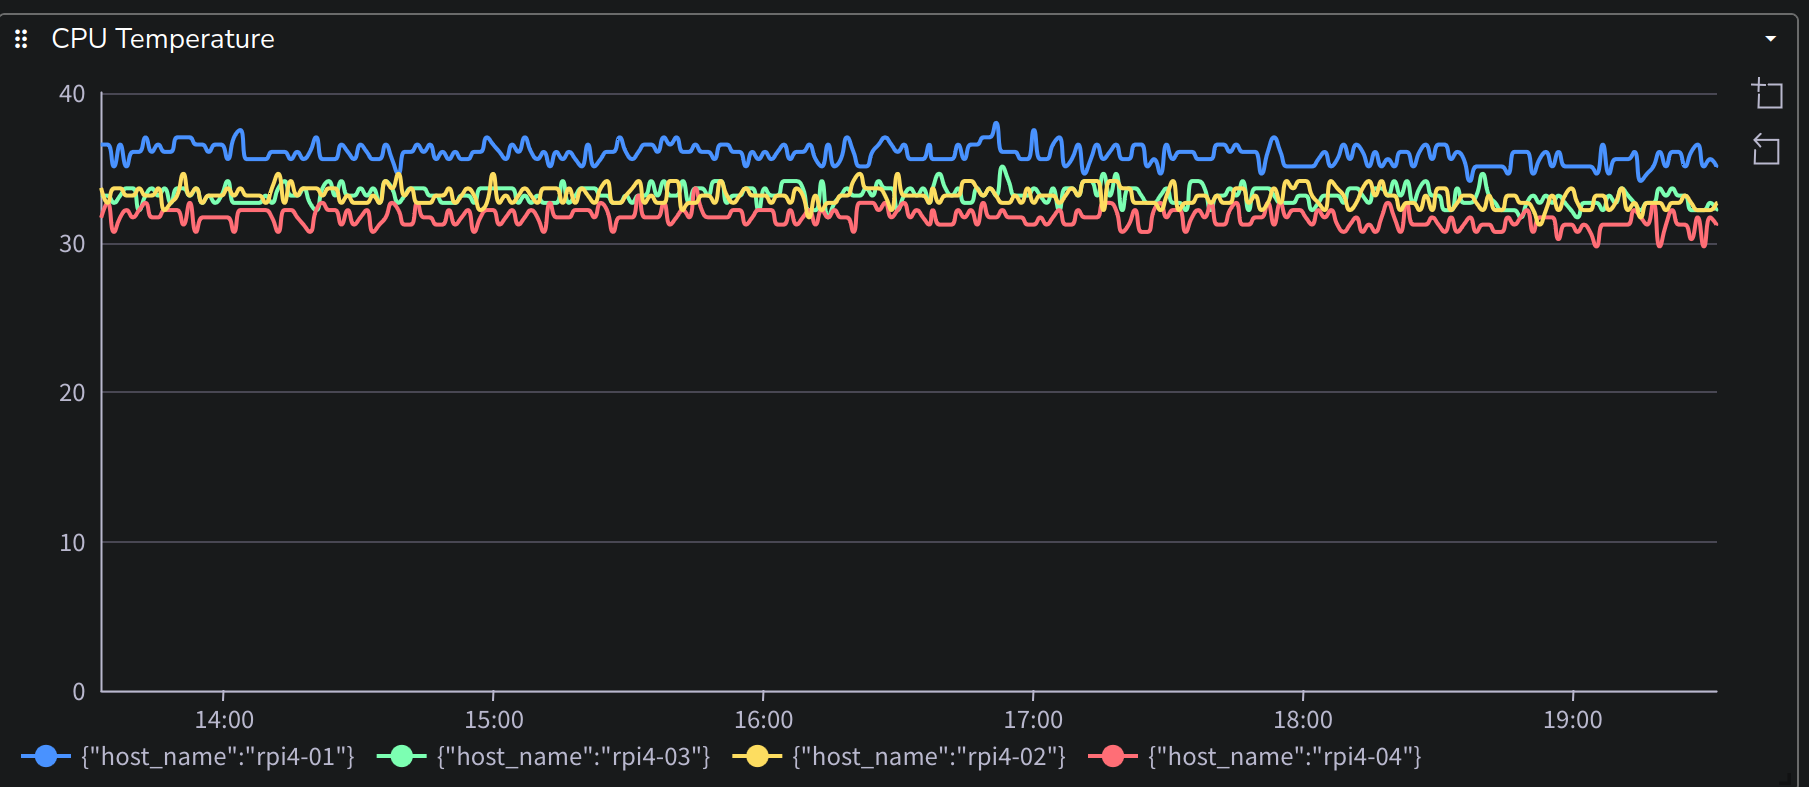
きっかけ
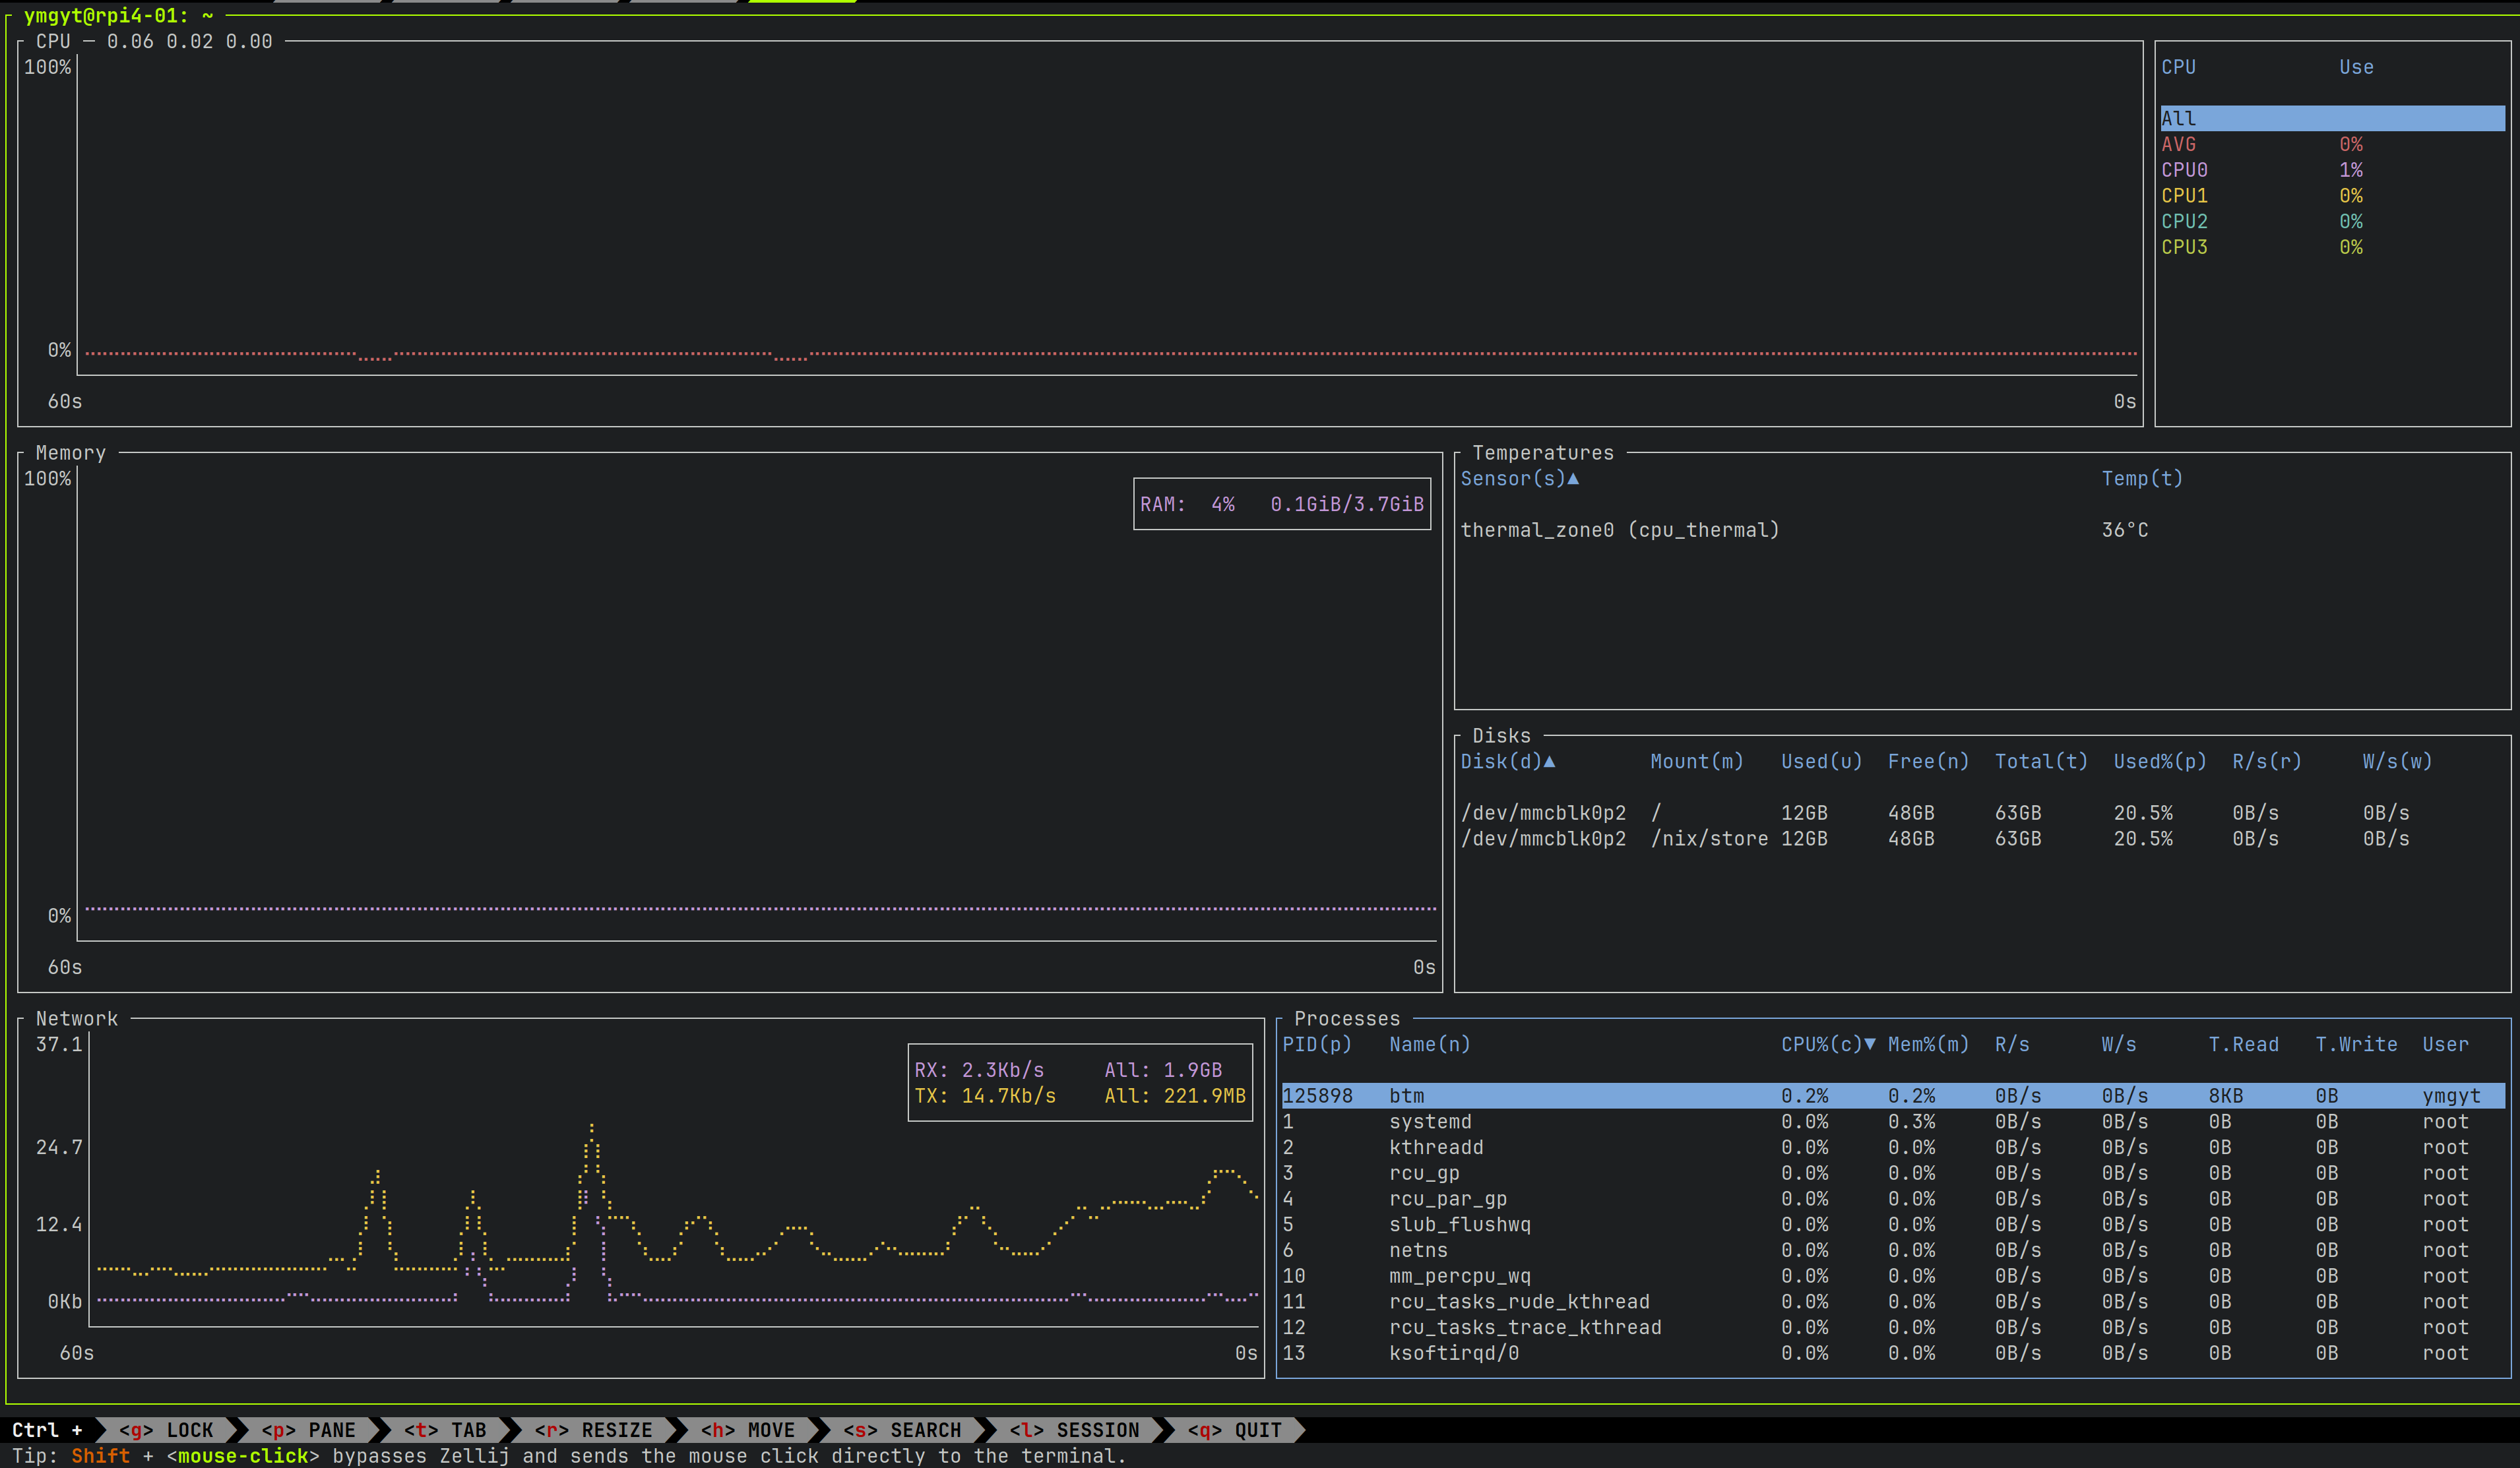
btmを実行しているとCPUの温度が表示されていました。(中段のTemperatures)
家に置いているのでraspiが熱くなって火事になったら怖いなと思い、CPU温度をmetricsにしてalertを設定したくなりました。
概要
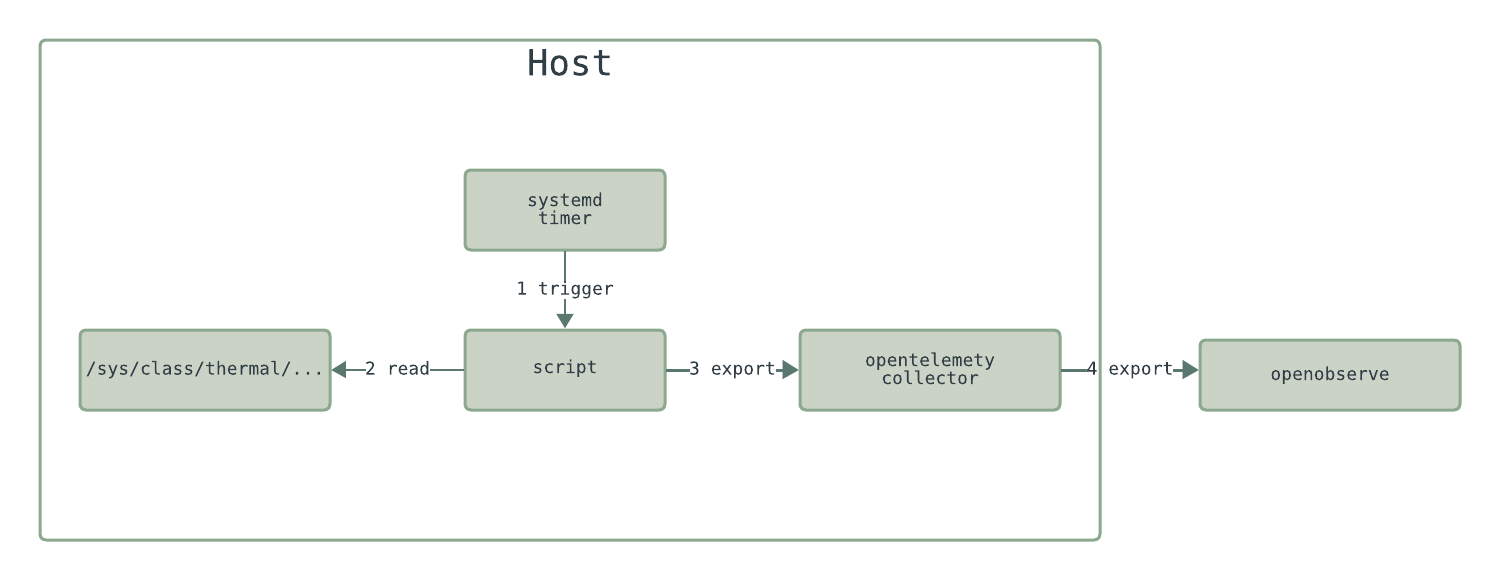
作成する処理の概要としては以下のようになります。
- systemd timerを利用してcpu温度を取得するscriptを定期実行する
- scriptの中でcpu温度を取得してlocalで起動しているopentelemetry-collectorにmetricsをexportする
- opentelemetry-collectorからopenobserveにexportする
systemd timerはcronのようなものです。systemd本を読んで知ったので利用してみます。
scriptの中で取得したcpu温度をopentelemetry-collectorに送るためにopentelemetry-cli(otel)を作りました。
scriptから直接openobserveにexportしないのは以下の点からです。
- Resource(そのmetricsがどこから来たかの情報)の取得や付与をcollector側で行いたい
- Retryやbatchもcollectorにまかせたい
- openobserveの認証情報を1箇所に置いておきたい
systemd timer
まずはscriptを定期実行するためにsystemd timerを設定します。
設定としてはいつどのserviceを呼び出すかを定義しておくとsystemd側でserviceを起動してくれます。
自分がすごいなと思ったのはAccuracySec=1mのように設定しておくと、指定の時刻から1分の範囲内で起動時間をrandomにズラしてくれ、その際の消費電力を最小化するようなことも考慮してくれる点です。
man systemd.timerの説明
Within this time window, the expiry time will be placed at a host-specific, randomized, but stable position that is synchronized between all local timer units. This is done in order to optimize power consumption to suppress unnecessary CPU wake-ups.
nixの設定は以下のように行いました。
modules/metrics/cpu-temperature/default.nix
{ pkgs, opentelemetry-cli, ...}:
{
  systemd.timers."cpu-temp-metrics" = {
    wantedBy = [ "timers.target" ];
    timerConfig = {
      Unit = "cpu-temp-metrics.service";
      OnCalendar = "minutely";
      Persistent = "false";
      AccuracySec = "1m";
     };
  };

  systemd.services."cpu-temp-metrics" =
  let
    otel = opentelemetry-cli.packages."${pkgs.system}".opentelemetry-cli;
  in
  {
    path = [
      pkgs.gawk
      otel
    ];
    script = builtins.readFile ./script.sh;
    serviceConfig = {
      Type = "oneshot";
      DynamicUser = "true";
      Nice = "19";
    };
  };
}systemd.timers."cpu-temp-metrics"がtimerの設定です。
man systemd.specialによると
timers.target
A special target unit that sets up all timer units (see systemd.timer(5) for details) that shall be active after boot.
It is recommended that timer units installed by applications get pulled in via Wants= dependencies from this unit.
This is best configured via WantedBy=timers.target in the timer unit's [Install] section. とあるので、wantedByにはtimers.targetを指定しました。
timerConfig.Unitには起動するserviceを指定します。
省略すると同じunit名のserviceが起動されるようですが明示的に指定しました。
timerConfig.OnCalendarが起動する時間です。minutelyが具体的にはいつなのかはman systemd.timeに定義されています。
timerConfig.Persistentはschedule時に電源がoffだった場合に起動時に実行するかの指定です。不要なのでfalse。
timerConfig.AccuracySecはさきほど述べた起動時間のwindowです。いつでもよいので、1mにしました。
上記のような設定をおこなうとsystemd上は以下のような設定が出力されました。
systemctl cat cpu-temp-metrics.timer
# /etc/systemd/system/cpu-temp-metrics.timer
[Unit]

[Timer]
AccuracySec=1m
OnCalendar=minutely
Persistent=false
Unit=cpu-temp-metrics.service
Scriptの作成
次に定期実行されるscriptを作成します。
scriptをraspiに設定してsystemd timerから起動するために以下のように設定しました。
modules/metrics/cpu-temperature/default.nix
{ pkgs, opentelemetry-cli, ...}:
{
  systemd.timers."cpu-temp-metrics" = {
    # ...
  };

  systemd.services."cpu-temp-metrics" =
  let
    otel = opentelemetry-cli.packages."${pkgs.system}".opentelemetry-cli;
  in
  {
    path = [
      pkgs.gawk
      otel
    ];
    script = builtins.readFile ./script.sh;
    serviceConfig = {
      Type = "oneshot";
      DynamicUser = "true";
      Nice = "19";
    };
  };
}systemd.services.<name>.scriptに実行したいscriptを指定するとscriptを実行するsystemd serviceを作れます。
このserviceはtimerから利用されることを意図しているので、serviceConfig.Type = "oneshot"を指定しました。
pathを指定すると、scriptの中から指定されたpackageにPATHが通っている状態にできます。opentelemetry-cliはmetricsをexportするために利用します。
これで必要な依存はnixが管理してくれるscriptが書けるようになりました。
CPU温度の取得
CPU温度を取得してopentelemetry-collectorにexportするscriptについてみていきます。
modules/metrics/cpu-temperature/script.sh
function get_cpu_temperature() {
  cat /sys/class/thermal/thermal_zone0/temp
}

function main() {
  local raw_temp=$(get_cpu_temperature)
  local temp=$(awk "BEGIN { print $raw_temp / 1000 }")

  # export to local collector
  otel export metrics gauge \
    --endpoint http://localhost:4317 \
    --name system.cpu.temperature \
    --description "cpu temperature" \
    --unit Cel \
    --value-as-double ${temp} \
    --attributes "thermalzone:0" \
    --schema-url https://opentelemetry.io/schemas/1.21.0
}

mainCPU温度の取得自体は/sys/class/thermal/thermal_zone0/tempをcatするだけです。
この処理はbottomの処理から盗みました。
commentに記載されているhttps://www.kernel.org/doc/Documentation/ABI/testing/sysfs-class-thermalでは以下のような説明がありました。
What: /sys/class/thermal/thermal_zoneX/temp
Description: Current temperature as reported by thermal zone (sensor).
Unit: millidegree Celsius
Metricsのexport
CPU温度を取得できたので、localで起動しているopentelemetry-collecotrにmetricsをexportしていきます。
opentelemetry-cliでは基本的にexportしたいmetricsをgrpc/protobufに詰め替えているだけです。
うれしいのは、otlp関連の処理はopentelemetry-protoのおかげで、生成されたrustのcodeを利用できるので、protobuf生成関連の処理をまかせることができる点です。なので1 metricsを送るだけなら本当に詰替えだけしか必要なかったです。
Exportするmetricsのdata modelに関してはprotobufのcommentの説明がわかりやすかったので引用します。
  Metric
//  +------------+
//  |name        |
//  |description |
//  |unit        |     +------------------------------------+
//  |data        |---> |Gauge, Sum, Histogram, Summary, ... |
//  +------------+     +------------------------------------+
//
//    Data [One of Gauge, Sum, Histogram, Summary, ...]
//  +-----------+
//  |...        |  // Metadata about the Data.
//  |points     |--+
//  +-----------+  |
//                 |      +---------------------------+
//                 |      |DataPoint 1                |
//                 v      |+------+------+   +------+ |
//              +-----+   ||label |label |...|label | |
//              |  1  |-->||value1|value2|...|valueN| |
//              +-----+   |+------+------+   +------+ |
//              |  .  |   |+-----+                    |
//              |  .  |   ||value|                    |
//              |  .  |   |+-----+                    |
//              |  .  |   +---------------------------+
//              |  .  |                   .
//              |  .  |                   .
//              |  .  |                   .
//              |  .  |   +---------------------------+
//              |  .  |   |DataPoint M                |
//              +-----+   |+------+------+   +------+ |
//              |  M  |-->||label |label |...|label | |
//              +-----+   ||value1|value2|...|valueN| |
//                        |+------+------+   +------+ |
//                        |+-----+                    |
//                        ||value|                    |
//                        |+-----+                    |
//                        +---------------------------+
//GaugeやSum(Counter)であってもnameやdescriptionは共通です。
それぞれのmetricは複数のDataPointをもち、datapointに値やtimestamp, attribute(例 state=idle)を保持します。
これを以下のようにしてexportしました。
  otel export metrics gauge \
    --endpoint http://localhost:4317 \
    --name system.cpu.temperature \
    --description "cpu temperature" \
    --unit Cel \
    --value-as-double ${temp} \
    --attributes "thermalzone:0" \
    --schema-url https://opentelemetry.io/schemas/1.21.0
Collectorにreceiverを追加
opentelemetry-collectorにgrpcでmetricsを送れるようにreceiverを追加します。
modules/opentelemetry-collector/config.yaml
receivers:
  otlp:
    protocols:
      grpc:
        endpoint: "127.0.0.1:4317"
# ...
service:
  extensions: [memory_ballast]
  pipelines:
    metrics:
      receivers:
        - otlp
#...
まとめ
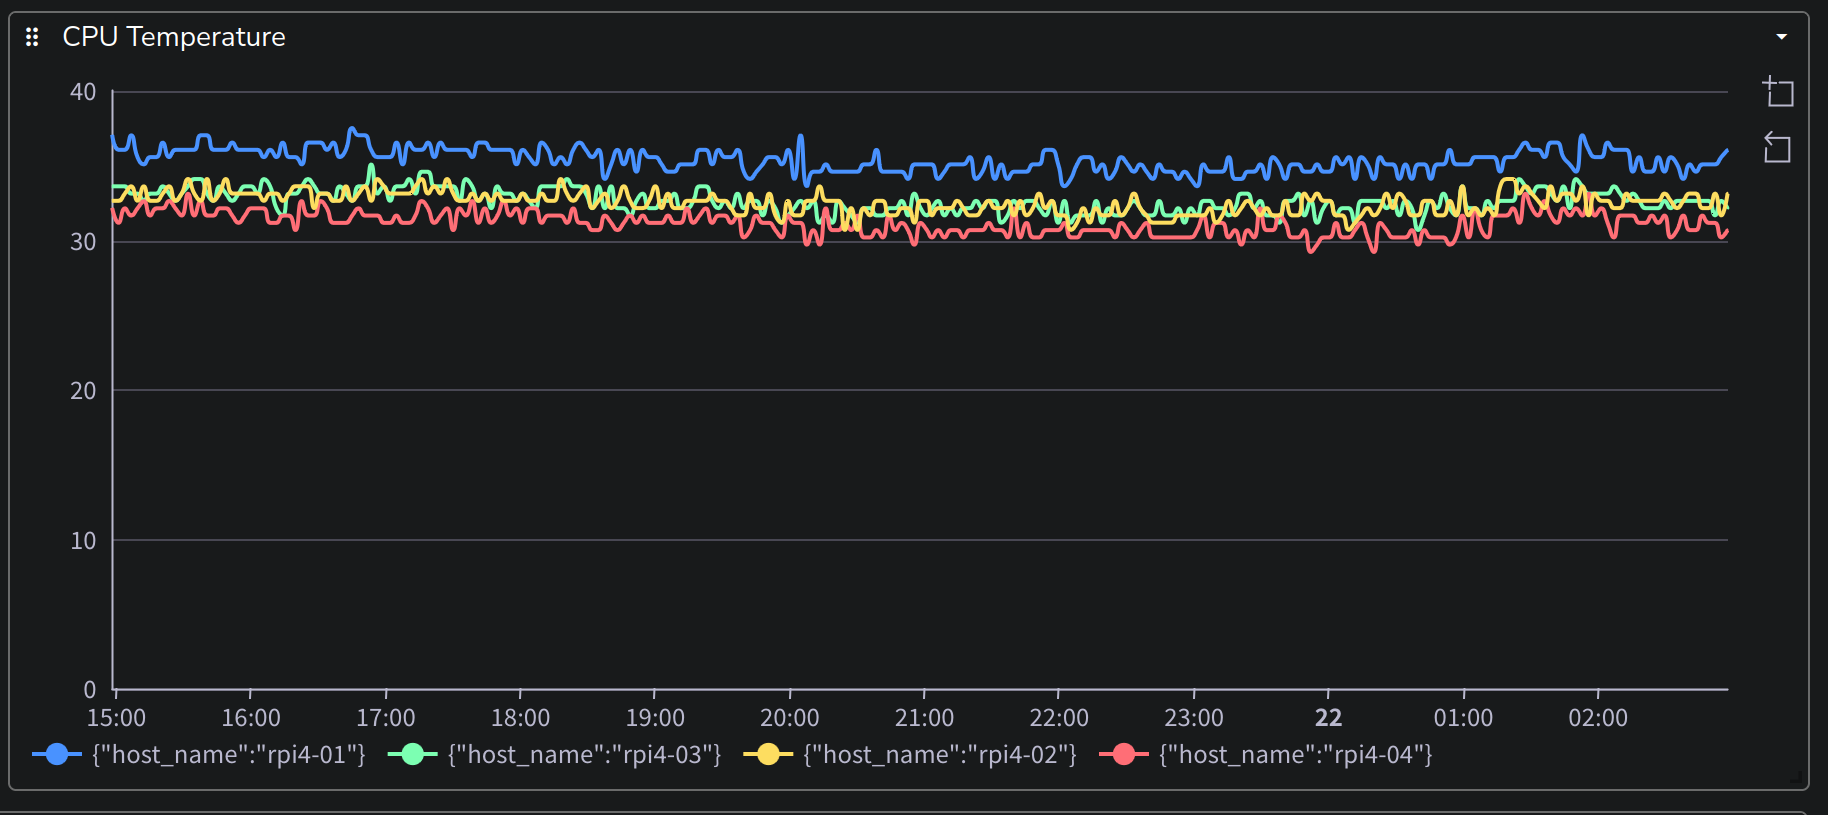
ここまでの設定をdeployすることで、CPUの温度をmetricsとして取得することができました。
概ね、30 ~ 35℃になっていました。
1台だけ(rpi4-01)だけ購入した時期が違うためか、若干、他のhostに比べて温度が高いということがわかりました。
ここまでお読みいただき、ありがとうございました。